Current News
- Marketing and Communication Controlling or: the Elephant in the Room
- Global Economic Conditions Survey: Economic Confidence among global accountants improved again in Q2 2024, despite a big drop in the US
- Flexibility comes from standardization
- What makes change difficult?
Seminar offer on this topic
Learn more about Power BI tools and how to use them

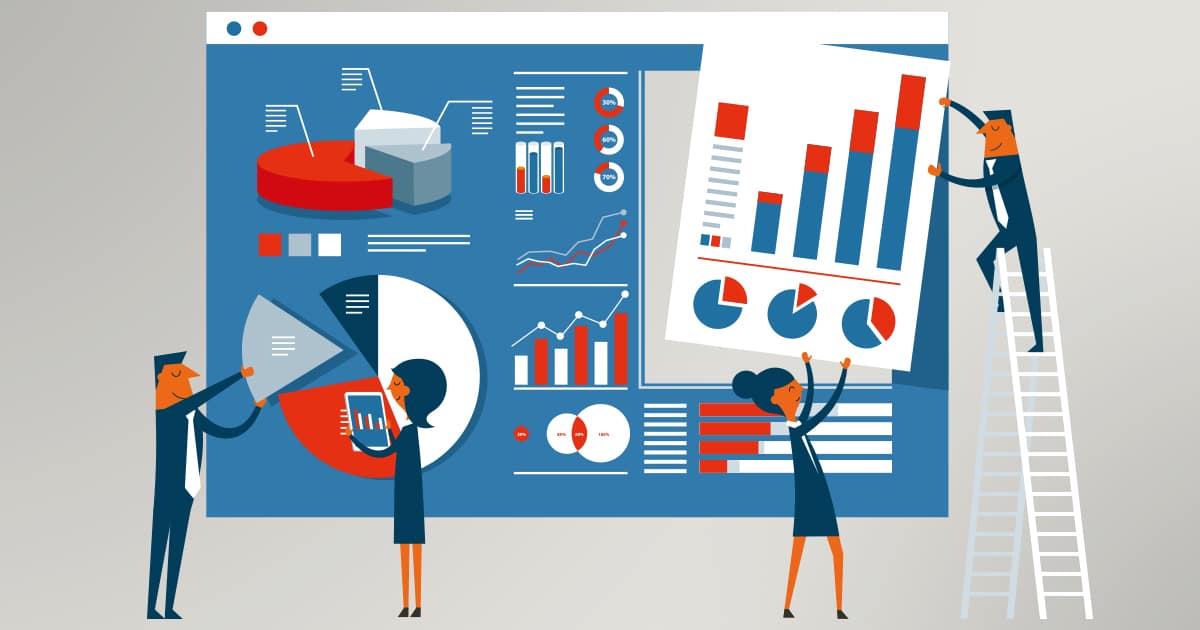
A typical task in the digital working world is the collection, structuring and visualization of data. Microsoft has developed a software package that provides graphical support for large amounts of data and is now used in many departments – Power BI. In Power BI, so-called visuals are created on the basis of existing data sources. These are charts and tables with dynamic control options, similar to pivot tables in Excel. The variety and the dynamics of the offered visuals bring many advantages but also new challenges. This is because the art of the report designer is to use these features sensibly and at the same time to convey content clearly.
This does not always have to be figures and data from the controlling department. A good example are applications from the HR area. Here, a number of HR reports are created, for example the determination of the headcount, the visualization of direct influencing factors (including the entry and exit of employees) or the determination of key figures for personnel deployment. Power BI offers excellent possibilities for this. Not only for the calculations and visualizations, but above all for the interactive analysis down to the last detail – and this on the smartphone, on the tablet as well as on the desktop.
In our live online training Interactive Reporting with Power BI, the seminar content is presented to you live and in person by our trainer Markus Wolff. You practice and discuss the practical application and concrete implementation of your learning objectives with the participants using virtual moderation tools. The trainer supports you individually in transferring the knowledge into practice and also addresses your situation. Our online support offers you further assistance between the live online training sessions. Here you get professional support for individual implementation questions to support the transfer into your organization.

